

The power of data visualization
- Jun 24, 2016
- 3 min read
SATHI works with children on railway platforms in India. It rescues them from the vagaries of the platform life and provides shelter and care till the time the child is returned home safely.
Having realised that one of the keys to provide value is timely application of analyses and creation on value based reports to aid in decision making, SATHI started using Goonjan to manage huge amounts of data they collect about the children they rescue.
Methodical collection & storage and seamless flow of data among all stakeholders of the organisation has not only helped them to better understand the work they do but also speed up the process of reuniting children with their families.
As an example, here are some valuable insights they were able to generate on account of having profiled the children diligently using Goonjan.
SATHI reunited 1855 children with their families between February and December 2015. 1846 boys, 8 girls and 1 transgender. These children were from 22 states of India and were spotted by SATHI at 8 major railway stations across India. 179 children were addicted to one or more of the following substances – Alcohol, Gutkha, Cigarette, Solution, Ganja etc.
Careful examination of this data revealed sharp differences in various parameters between those children who were addicted and those who weren’t. Here are few insights that were generated from Goonjan.

The proportion of those who were Idle or Working is 11.48 % points higher among those who were addicted to one substance or the other compared to those who weren't.
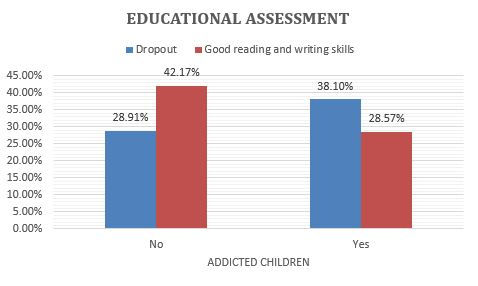
28.91% of the children were not addicted had dropped out of school compared to 38.1% of children among those who were addicted.
42.17% of the children who were not addicted had good reading/writing skills compared to just 28.57% of children among those who were addicted.
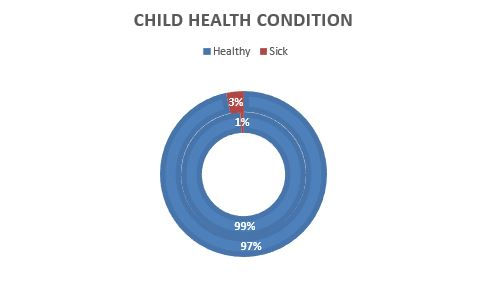
Outer ring represents children who were addicted and inner ring represents those who weren't.
The % of children who were diagnosed as sick was thrice among those who were addicted compared to those who weren't.

'
Outer ring represents children who were addicted and inner ring represents those who weren't.
The % of children who categorised the condition of their family as 'Difficult' was almost double among those who were addicted compared to those who weren't.

This graph shows a comparison of what the mix of 'reason given by child for running away' was among children who were addicted and those who weren't.
29.05 % of children who were addicted cited 'City attraction' as reason for running away
28.51% of children who were not addicted cited 'City attraction' as reason for running away
So on. .
The mix is pretty consistent for all reasons given except 'Peer company' and 'Others'. For the category 'Peer company' the percentage of children among those who were addicted was 1.77 times that of children among those who weren't addicted.

Outer ring represents children who were addicted and inner ring represents those who weren't.
The % of children who give differing information to the counsellors at SATHI was double among those who were addicted compared to those who weren't.

Relatively, higher proportion of children who were addicted demonstrated signs of anger and depression compared to those who weren't. Also, the % of children who tried to escape from the shelter house was almost 4 times higher among those who were addicted compared to those who weren't.
This is just a simple representation of limited insights generated from few data points. SATHI uses Goonjan to track, store and analyse huge amounts of data that are generated at different points in time during their engagement with the children,
First contact
Counselling
The process of reunification
Follow up
Etc.
It should be noted that the purpose of this blog post is not to make any assertions on back of the data presented but to illustrate the value that is generated when organisation choose to embrace technology.
Here is a link to their website.
About Goonjan
Goonjan is a software for nonprofits designed to help NGOs fulfil the mission of their organization. It is an integrated platform which you can use to track your beneficiaries, provide services efficiently and manage your donors among many other things. In simple terms - A database software for nonprofits. Since all of it is interconnected, extracting reports to study the impact of various stakeholders and report to concerned agencies becomes very easy and simple to do. It is open to integrate with other existing systems an NGO may be using and certain portions of the software can be customised to cater to the unique needs of an NGO.


header.all-comments